>>>>>> NOTE: A newer blog post about tools for working with Kill Bill on AWS is here! <<<<<<
Measurements and metrics are an important part of managing your Kill Bill system to ensure that performance is optimized and any problems can be detected early. Kill Bill collects over 1,300 metrics to show you every conceivable view of your system’s behavior.
Several third-party tools are available to manage and display metrics of this type. One popular tool is Datadog. This package offers a low-cost option to monitor and display whatever metrics you may find useful from the Kill Bill collection. This includes metrics that show the performance and resource use of Kill Bill and Kaui themselves as well as metrics describing the infrastructure on which these systems run.
In this article, we discuss using Datadog to manage metrics produced by two types of Kill Bill implementations on Amazon Web Services (AWS): single-tier and multi-tier. With the latest Amazon Machine Image (AMI) for Kill Bill, it’s very easy to direct the Kill Bill metrics to Datadog and work with them in whatever way you need.
Note: Five years ago, we published a blog post on running Datadog in a non-AWS environment.
Check Your Kill Bill Version
We assume that you have a working Kill Bill implementation running on AWS, using either the single-tier or multi-tier installation options:
- Single-tier—Runs Kill Bill, Kaui, the MariaDB database and the NGINX load balancer on a single AWS EC2 instance. This is suitable for quick deployment and for testing and development.
- Multi-tier—Runs Kill Bill and Kaui on two or more separate EC2 instances and uses an AWS RDS database manager along with an AWS load balancer. This is an attractive option for many production uses.
You should be running Kill Bill version 2021.9 or later. This version can be configured to provide its full collection of Kill Bill metrics to Datadog (and several other analysis tools).
To check your Kill Bill version, open Kaui on a browser tab and access the Kill Bill admin page. You should see the “Kill Bill Premium edition:”
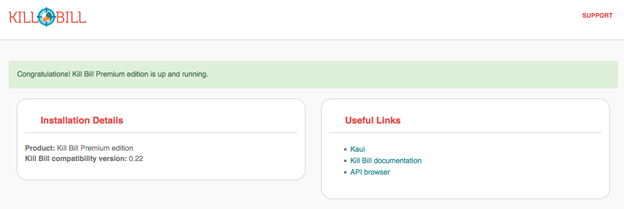
If you see this page you are ready to go! If not, you should upgrade your installation.
While you are on this page, if you want to see all the metrics that Kill Bill has to offer, just add the path /1.0/metrics to the URL. Have fun! If you find these metrics hard to understand, Datadog can help.
Set Up Datadog
You may already be familiar with Datadog. If not, this section will explain how to get started.
First, go to the Datadog website. Sign up for the free trial by selecting “Get Started Free” at the top of the page.
Note: After the trial, you will be charged monthly depending on what types of information you want them to manage.
When you log in to Datadog, you are taken to the Welcome page. Note the series of menu options on the left hand side.
To set up Datadog to manage the metrics available from Kill Bill, you’ll need to authorize the transfer of the complete Kill Bill metrics.
Set Up the Authorization
To authorize the sending of the Kill Bill metrics, it is necessary to edit two lines in this file:
/var/lib/tomcat/bin/setenv2.sh
This file contains configuration information for tomcat, which manages the KillBill web applications. This is a small file. The two lines to be edited are:
-Dcom.killbill.datadog.enable=false

-Dcom.killbill.datadog.apiKey=
These should be changed to
-Dcom.killbill.datadog.enable=true

-Dcom.killbill.datadog.apiKey=Your-API-Key
To find your API key:
- Go to the Datadog Welcome page.
- Scroll down to your email address in the left menu.
- Select Organization Settings from the popup menu.
- Select API Keys from the Organization Settings menu.
After editing the file, go to your AWS EC2 dashboard and reboot the instance so the new configuration file is read. If you have more than one instance, follow the same procedure for each one.
Now select Metrics, then Summary from the menu. After a short delay, you should see a lot more metrics—well over 1,000 in your list.
Congratulations! Your Datadog integration is complete!
Select Metrics in Datadog
The Datadog site has a lot of documentation, so we won’t repeat any of that here. We will just suggest a few quick steps to get started:
- Go to Metrics in the menu and Explorer in the submenu. Click on the field labeled Graph: to get a dropdown list of all available metrics.
- Select some metrics to see the graph they produce. Identify the ones you would like to see together in a dashboard. (See the text box below.)
- Gather the names of the metrics you want in the Graph: field together.
- Under Export these graphs to: select New Dashboard. Give your dashboard a name.
Your dashboard will appear in the Dashboard List under the Dashboards menu item. You can create and modify multiple dashboards. You can also adjust the graphs in many ways and do other things, like set alarms. Have fun and good luck!
Helpful Kill Bill Metrics with Datadog
- Database connection pool(s): Does Kill Bill have enough threads configured? Do they take a long time coming back to the pool(s)? While Kill Bill scales horizontally, a badly configured database could become a bottleneck.
- Logging: What is the relative rate of INFO, WARN and ERROR events? These can be a good proxy of the overall health of the system.
- Payments latency: How long do API calls to the gateways take? In several occasions, we were able to discover outages before being notified by the gateway itself.
- HTTP response codes: What is the rate of API calls made by the clients, per endpoint and response code?